Cohort and Content Variability in Value-Added Model School Effects
Daniel Anderson
Joseph Stevens
University of Oregon
Introduction
Value added Models, or VAMs:
- Are intended to measure the effect of teachers and/or schools on students' achievement
- Establishing the stability (reliability) of the models is prerequisite to establishing validity, which is foundational for their use in high-stakes policy applications
Study purpose
- Evaluate the stability of school-level VAM estimates across cohorts and content area.
Cohort effects
- VAMs assume estimates do not depend on the specific sample of students modeled.
- Typically, only one year of data is included in estimates.
- Estimates may then be representative of policy or implementation effects
- Student mobility is high in many schools
- If school effects do depend, in part, on sampling variability, then the validity of estimates is threatened
Content effects
Little research has explicitly explored the difference in school rankings by the content area.
Much research has investigated school effects in a single content area, while ignoring others (Raudenbush and Bryk, 1986; Raudenbush and Willms, 1995)
Should we expect schools to have the same effect across content areas? What does it mean if different effects are observed?
Research Questions
- What is the stability of school effect estimates across cohorts and content area (reading and math)?
- What proportion of the variance in students' scores is attributable to school, cohort, or content facets?
- How does the number of cohorts modeled impact the reliability of school effect estimates?
Methods: Sample
Demographics
|
Proportion |
| nonWhite |
35 |
| SWD |
12 |
| Female |
50 |
| FRL |
50 |
- Operational statewide accountability data
- Three cohorts of students matched longitudinally across Grades 3-5 (approximately 27000 students per cohort)
- 727 schools, with an average of 122.44 students per school (SD = 95.17)
Analysis plan
- Fit a VAM to each cohort of students in each content area
- Explore changes in schools' normative rank across models
- Fit a combined model across cohorts
- Use Generaliziability Theory to (a) estimate the reliability of school effects, and (b) project reliability, given a change in the number of cohorts modeled.
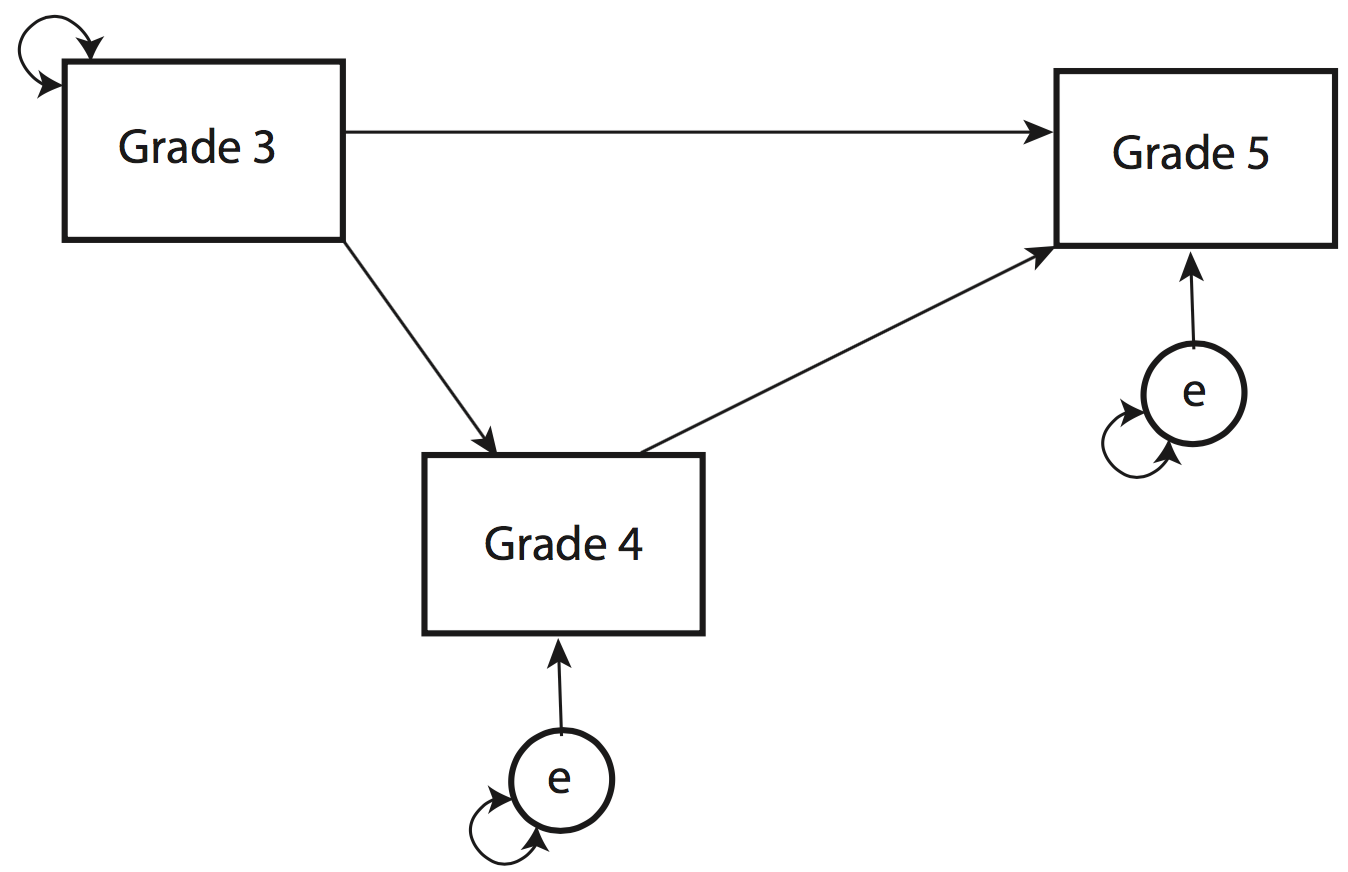
Basic school-effects model
\[
RIT_{ig} = \alpha + \beta_1(g4) + \beta_2(Pr \times g3_4) +
\beta_3(Pr \times g3_5) + \beta_4(Pr \times g4_5) + r_i + u_j + e_{ij}
\]
- \(RIT_{ig}\): State test score in Grade \(g\) for student \(i\) (includes both students' Grade 4 and Grade 5 data)
- \(\alpha\): Model intercept (mean Grade 5 scores, given average Grade 3 and 4 scores)
- \(g4\): Dummy code indicating if the outcome was in Grade 4 (rather than Grade 5)
- \(Pr\): Students prior state test score
- \(g3_4\): Grade 3 prior state test score, Grade 4 outcome
- \(g3_5\): Grade 3 prior state test score, Grade 5 outcome
- \(g4_5\): Grade 4 prior state test score, Grade 5 outcome
- \(r_i\) and \(u_j\): Random by-student and by-school variation
- \(r_i \sim N(0, \sigma_{stu})\)
- \(u_j \sim N(0, \sigma_{sch})\)
- \(e_{ij}\): Unmodeled residual variance
- \(e_{ij} \sim N(0, \sigma_{e})\)
Breaking the model apart
Grade 4 outcome
\[
RIT_{i4} = \alpha + \beta_1(g4) + \beta_2(Pr \times g3_4) + r_i + u_j + e_{ij}
\]
Grade 5 outcome
\[
RIT_{i5} = \alpha + \beta_3(Pr \times g3_5) + r_i + u_j + e_{ij} \\\
RIT_{i5} = \alpha + \beta_4(Pr \times g4_5) + r_i + u_j + e_{ij}
\]
Fixed-effects portion of the model
Note the residual variances were constrained to be equal
Combined model
\[
RIT_{ig} = \alpha + \beta_1(g4) + \beta_2(Pr \times g3_4) +
\beta_3(Pr \times g3_5) + \beta_4(Pr \times g4_5) + \\
r_i + u_j + v_c + v_cu_j + e_{ij}
\]
- \(v_c\): Random cohort variation
- \(v_c \sim N(0, \sigma_{coh})\)
- \(v_cu_j\): Random cohort by school variation (latent interaction variable)
- \(v_cu_j \sim N(0, \sigma_{cohSch})\)
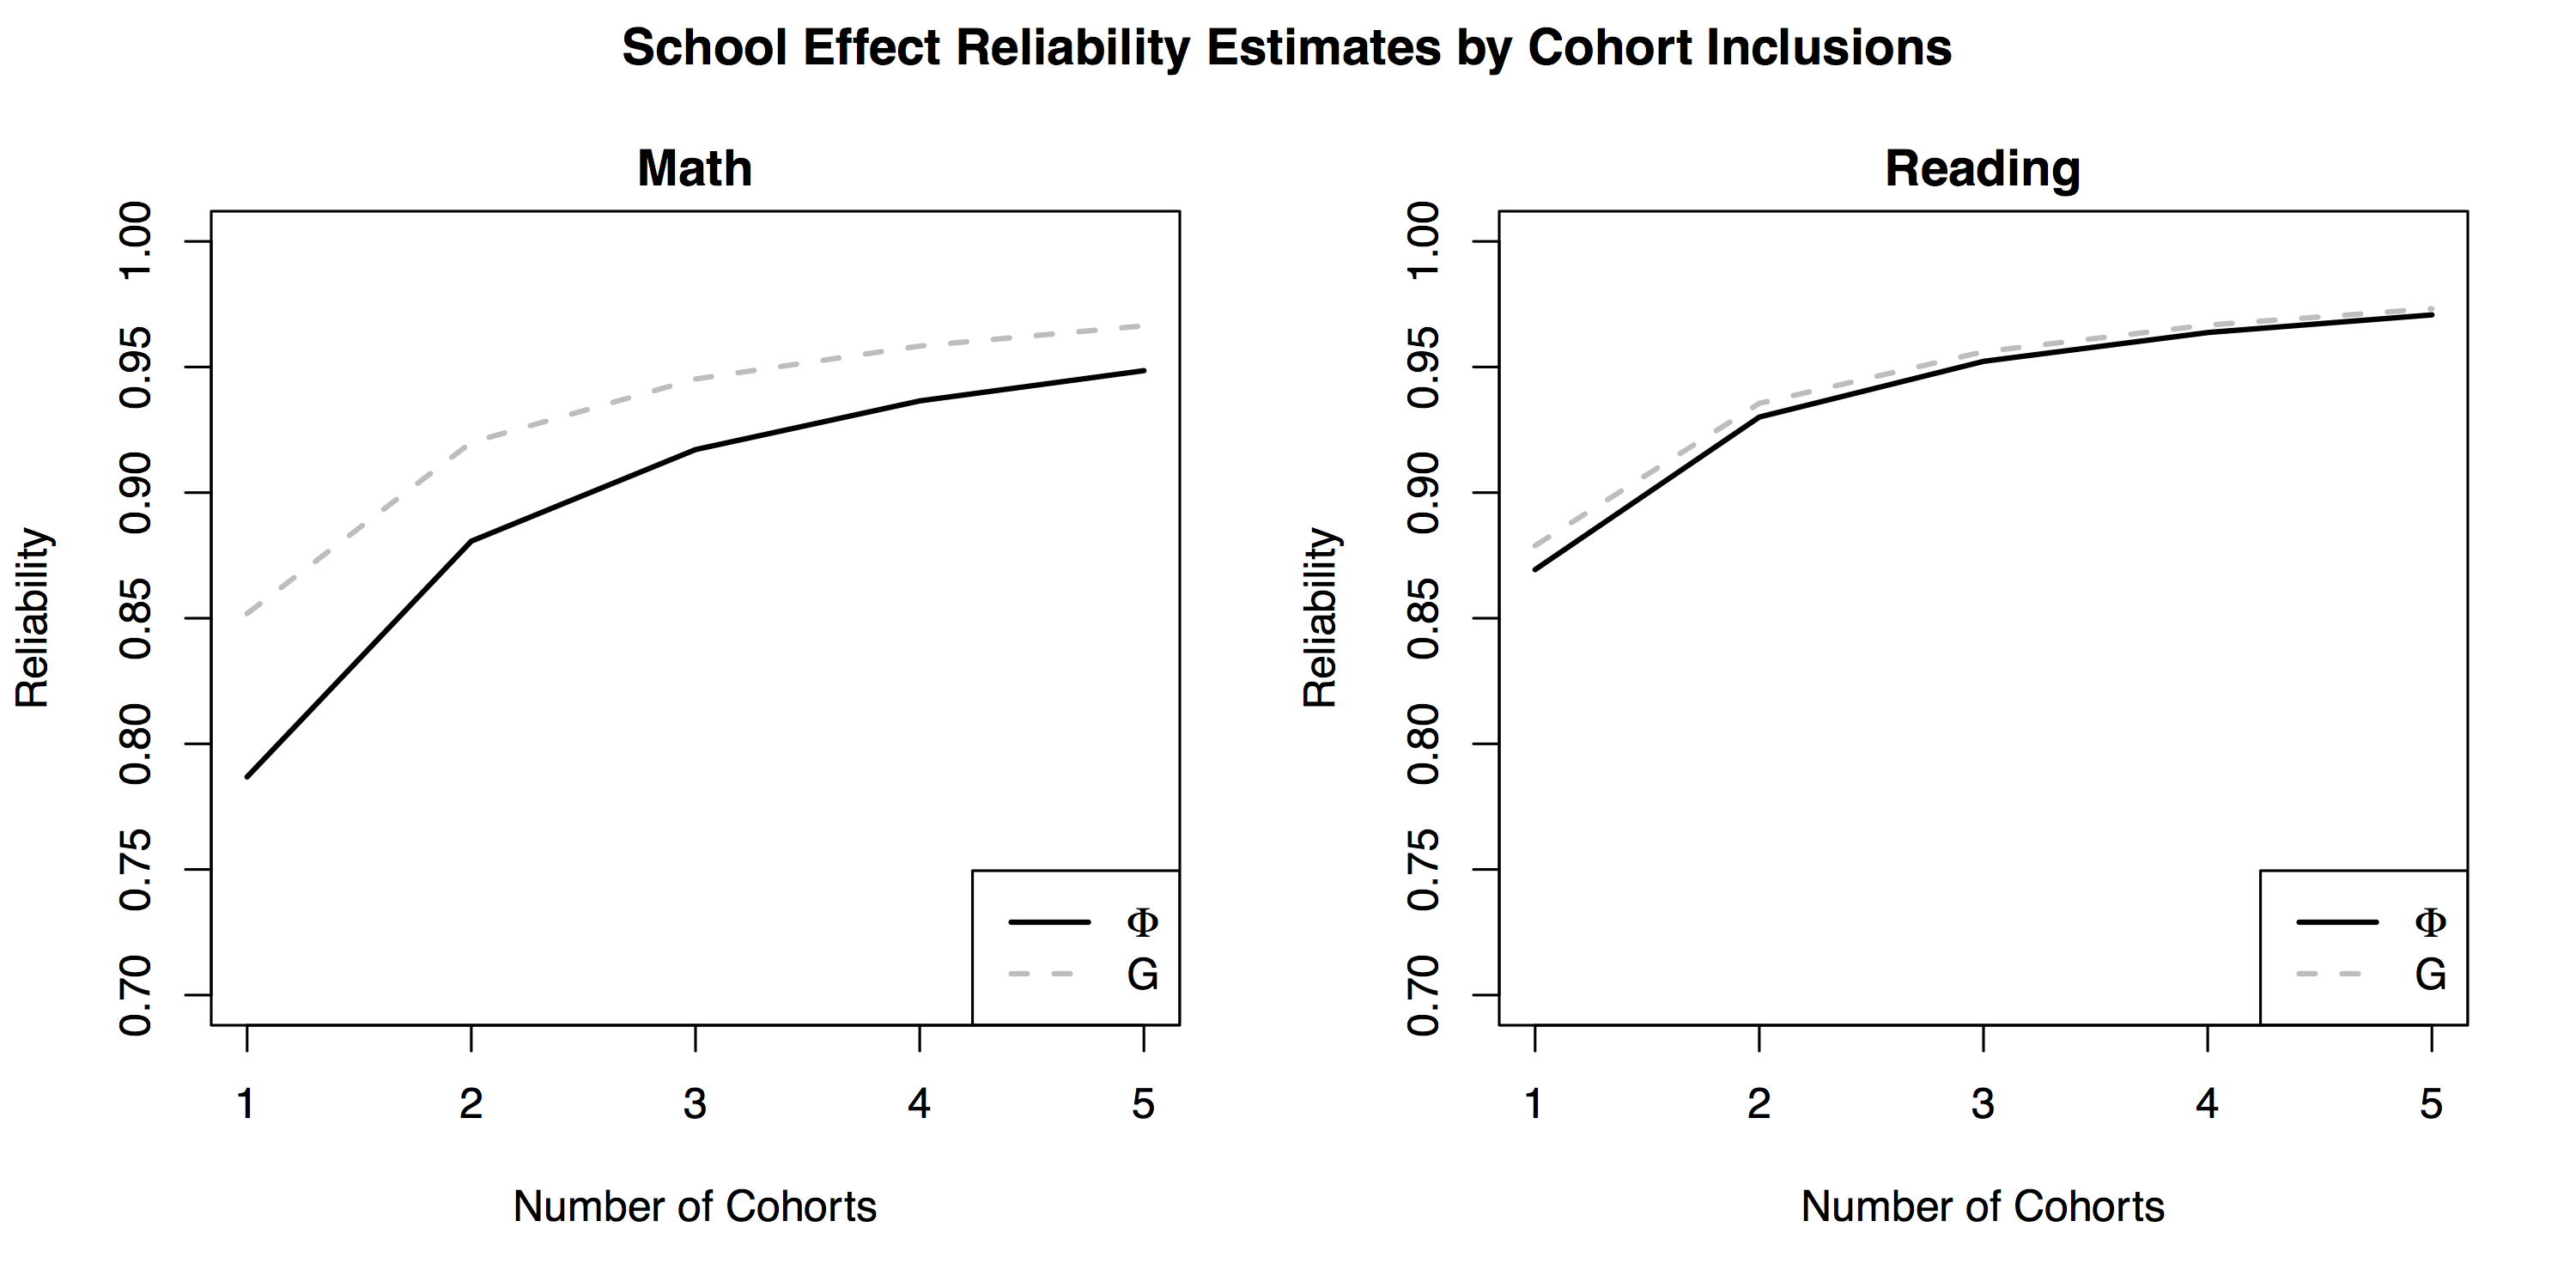
G-Theory
Relative reliability coefficient
\[
G = \frac{\sigma_{sch}^2}{\sigma_{sch}^2 +
\frac{\sigma_{cohSch}^2}{n_{coh}'} +
\frac{\sigma_{e}^2}{n_{stu}'n_{coh}'}
}
\]
Absolute reliability coefficient
\[
\Phi = \frac{\sigma_{sch}^2}{\sigma_{sch}^2 +
\frac{\sigma_{stu}^2}{n_{stu}'} +
\frac{\sigma_{coh}^2}{n_{coh}'} +
\frac{\sigma_{cohSch}^2}{n_{coh}'} +
\frac{\sigma_{e}^2}{n_{stu}'n_{coh}'}
}
\]
- A priori minimal threshold for reliability: 0.90
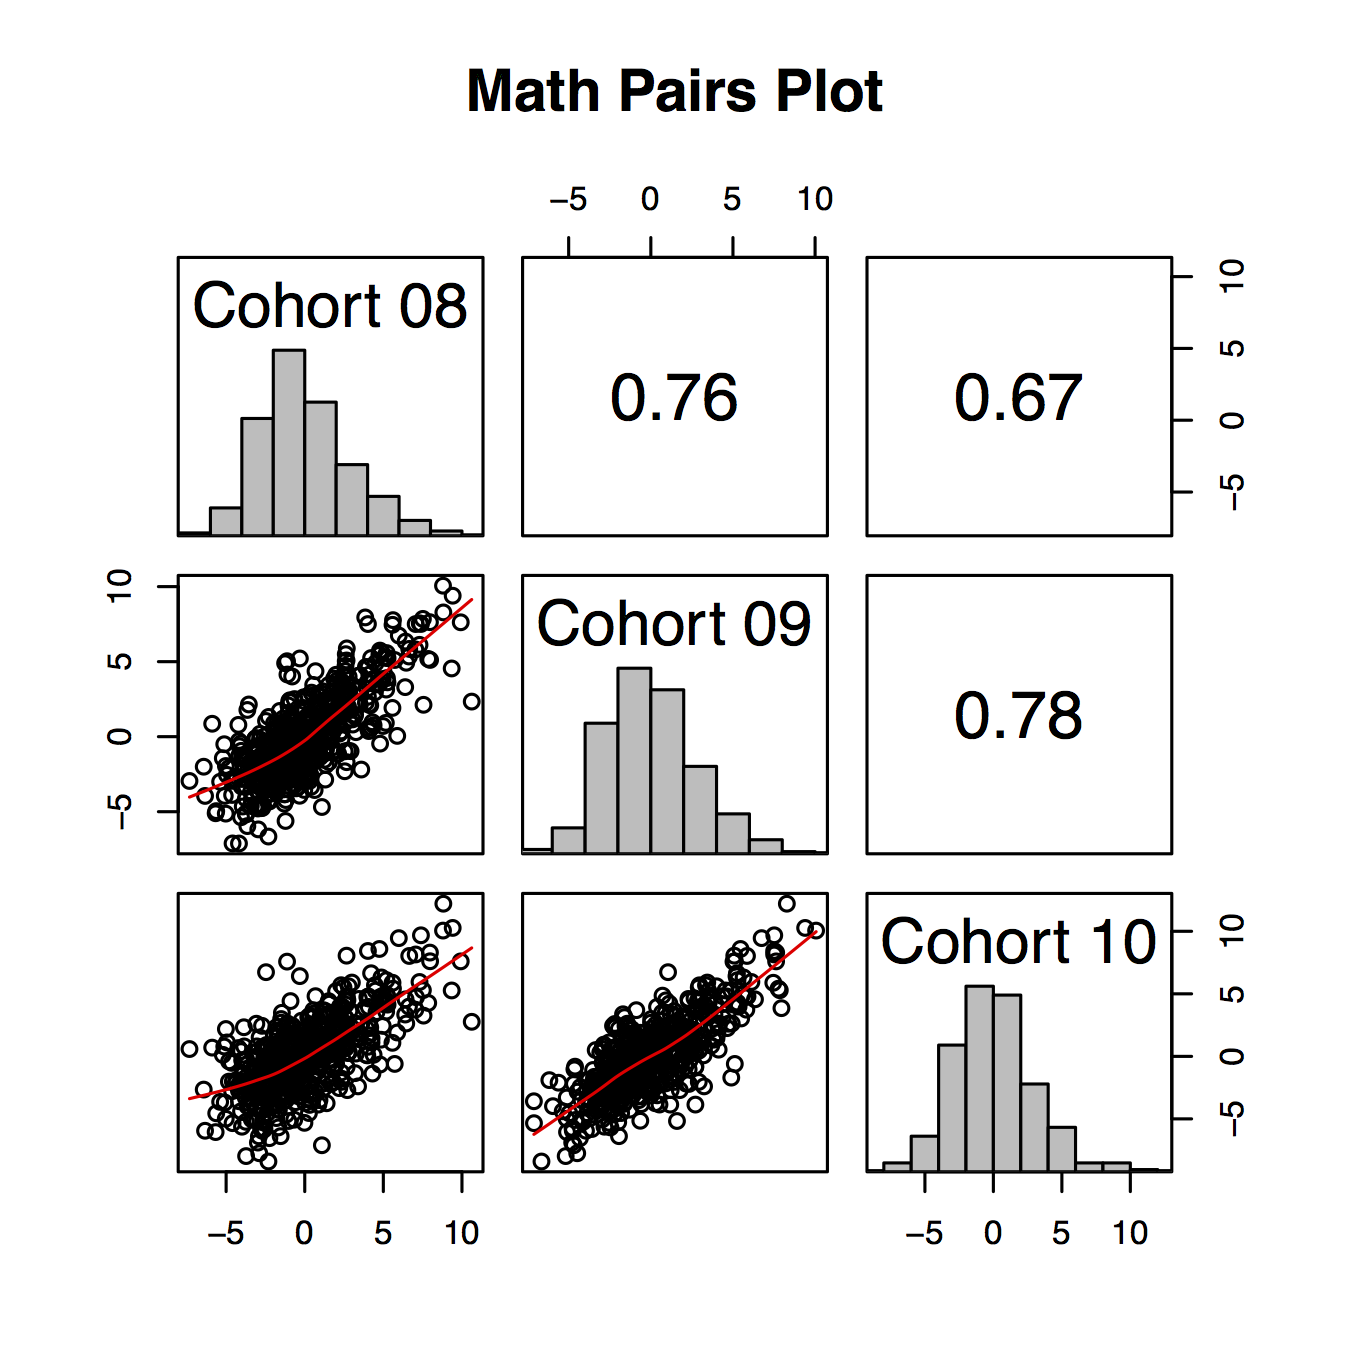
Results: School-effect variability across cohorts (math)
- ~ 33.77% of schools did not change quartiles
- ~ 53.66% changed quartiles at least once
- ~ 12.57% changed quartiles between each cohort modeled
- ~ 22.7% of schools changed more than one quartile
- ~ 3% of schools moved from the bottom to the top quartile, or vice versa, depending on the specific cohort modeled
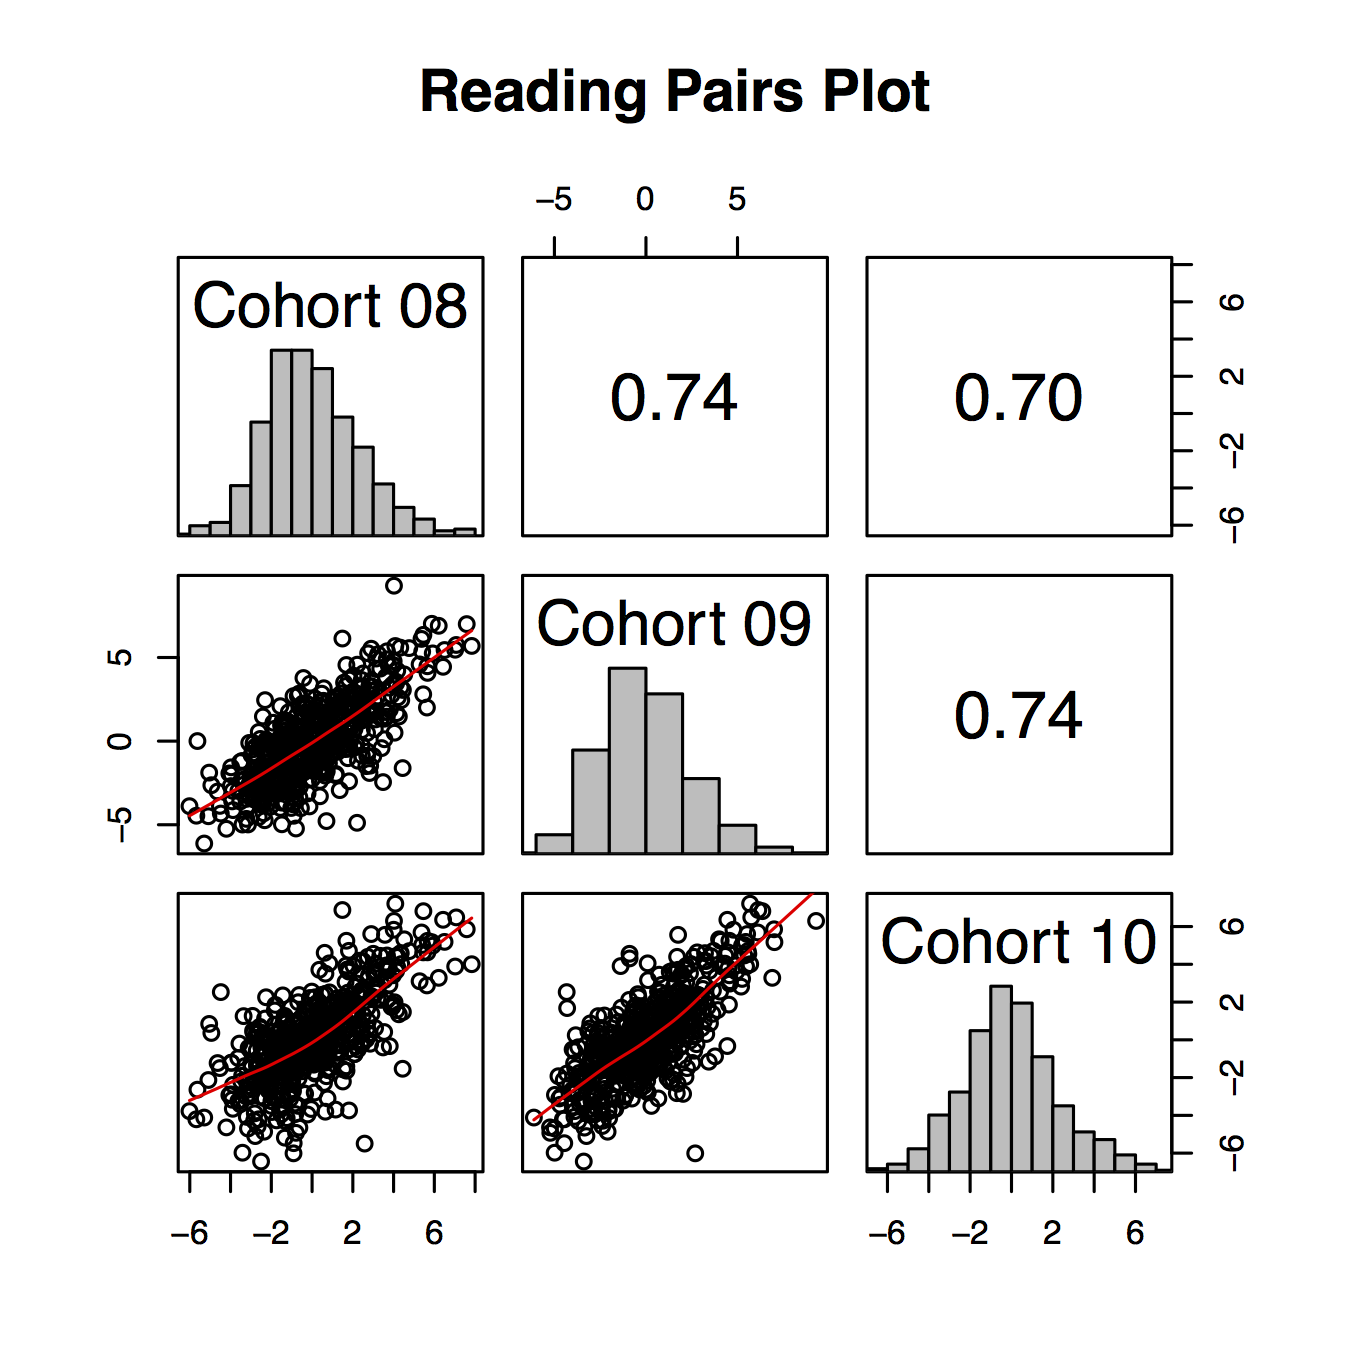
Results: School-effect variability across cohorts (reading)
- ~ 33.71% of schools did not change quartiles
- ~ 53.11% changed quartiles at least once
- ~ 13.18% changed quartiles between each cohort modeled
- ~ 22.41% of schools changed more than one quartile
- ~ 3% of schools moved from the bottom to the top quartile, or vice versa, depending on the specific cohort modeled
Variability across content areas
- ~ 53%, 55%, and 52% of schools maintained their normative quartile ranking between content areas, for Cohorts 08-10, respectively
- ~ 36% to 39% of schools changed one quartile
- ~ 7% to 9% of schools changed two quartiles
Results: G-Theory
Variance Components
|
Math |
Percentage |
Reading |
Percentage |
| \(\sigma_{stu}^2\) |
55.63 |
67.5 |
44.02 |
68.43 |
| \(\sigma_{sch}^2\) |
8.68 |
10.5 |
6.07 |
9.44 |
| \(\sigma_{coh}^2\) |
0.84 |
1.0 |
0.08 |
0.12 |
| \(\sigma_{cohSch}^2\) |
1.51 |
1.8 |
0.84 |
1.30 |
| \(\sigma_{e}^2\) |
15.82 |
19.2 |
13.32 |
20.71 |
$G =$ 0.95 and 0.96 for reading and math, respectively
$\Phi =$ 0.92 and 0.95 for reading and math, respectively
- Majority of variance associated with students, followed by unmodeled variance
- Schools next most important facet
- Cohort and cohort by school variance negligible, relative to the whole
Discussion
- VAMs applied in high-stakes policy settings generally assume the estimates are independent of sampling variability.
- Results of this study suggest high variability depending on the specific cohort of students modeled
- Generally, a single number is used to quantify the school effect
- Results of this study indicate a more nuanced and multidimensional representation may be more appropriate
- Projected reliability was moderate when a single cohort was modeled
- Reliability increased dramatically with the inclusion of even one additional cohort
Limitations and future directions
- This study investigated "pure" cohort effects, but annual estimates may be more reflective of how the models are applied in practice.
- What's the year-to-year stability?
- Unclear the extent to which changes in school ranks were attributable to sampling variability versus "true" changes in school functioning
- School persistence was not modeled directly
Thanks!
This research was funded in part by a Cooperative Service Agreement from the Institute of Education Sciences (IES) establishing the National Center on Assessment and Accountability for Special Education (NCAASE; PR/Award Number R324C110004); the findings and conclusions expressed do not necessarily represent the views or opinions of the U.S. Department of Education.
Correspondence concerning this manuscript should be addressed to Daniel Anderson, IES Post-Doctoral Research Fellow, Center on Teaching and Learning, University of Oregon. E-mail: daniela@uoregon.edu